Averages and measures of dispersion
Averages
Mean, median, and mode are three kinds of “averages”. There are many “averages” in statistics, but these are most common.
Mean
“mean” is a statistical “average”, where you add up all the variables and then divide by the number of variables.
Median
The “median” is the “middle” value in the list of variables. To find the median, your variables have to be listed in numerical order from smallest to largest, so you may have to rewrite your list before you can find the median.
Mode
The “mode” is the value that occurs most often. If no variable in the list is repeated, then there is no mode for the list.
Measures of dispersion
Variance
It is the sum of average squared difference of mean.
e.g: x1, x2, x3, xn are a list of n number of values, then mean, x̄ = (xn + x1 )/n. Then the
\[ Variance= Σ (x-\bar{x})^2/ (n-1)\]
Standard deviation
It is the measure of standardized dispersion of data from the mean. It is calculated by taking the square root of variance.
Standard deviation σ = √∑, i.e., standard deviation is the square root of variance.
Assume that someone is asked to walk on a straight line from point a to point b. The individual steps taken by the person can be equated to standard deviation and the variance is the deviation of the path from the central line.
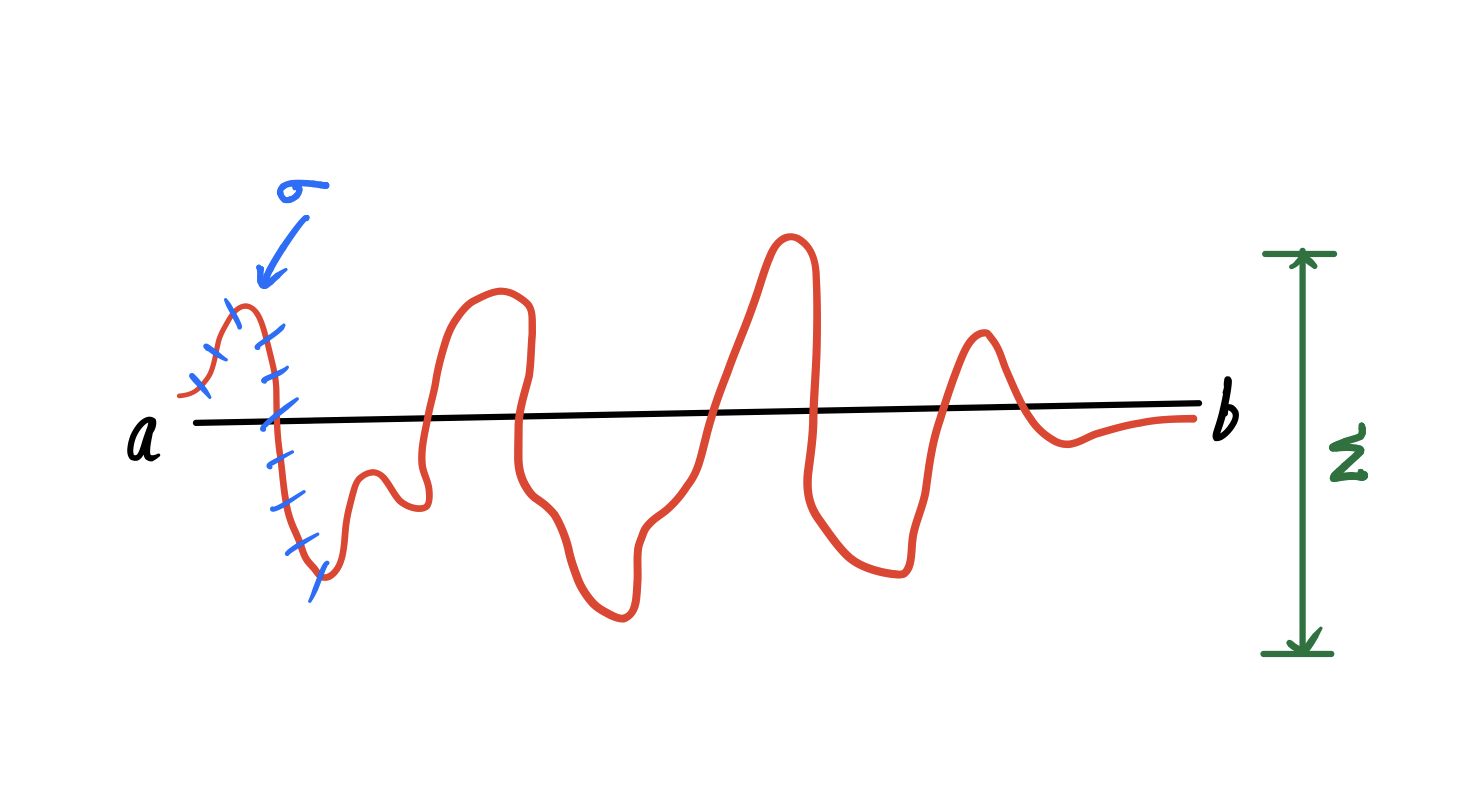
σ is the standard deviation and Σ is the variance
Unlike standard deviation variance can identify the outliers and also shows the spread of the data.
Standard error of mean(SEM)
\[ \sigma/\sqrt n \]
It is the standard deviation of the sample mean from the population mean.
Assume that there is a population of 1000 members. In order to study the average height of the population, we have to select a sample size. Also assume that one scientist y started a study with a sample size of 50. He repeated the study for n times. He found that each time the average height found out from the study was different. He calculated the mean value of the height from these n studies and designated it as x̄1. This x̄1 is the sample mean for his study.
Another scientist z selected a sample size of 10 and conducted n number of similar study and similarly he also got a sample mean, x̄2. So they decided to find out the actual population mean x̄ by studying the entire population. This deviation is called Standard error of mean
They also calculated how far the x̄1 and x̄2 deviate from x̄. The deviation of x̄1 was found to be less than x̄2.
When n increases, standard error of mean decreases and the precision of the study increases.